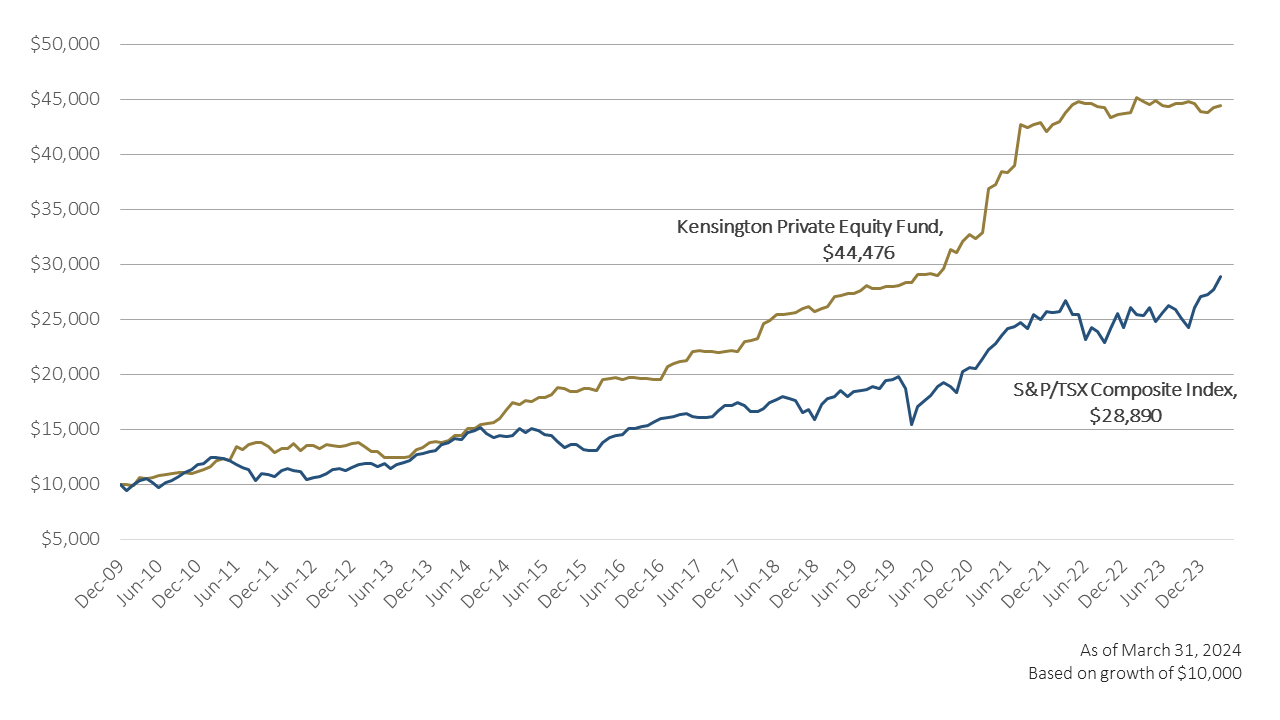
Growth of Capital Graph, Kensington Private Equity Fund vs. S&P/TSX Composite TR Index
Jan | Feb | Mar | Apr | May | Jun | Jul | Aug | Sep | Oct | Nov | Dec | Year-to-Date | |
– Initial portfolio construction period – |
|||||||||||||
2010 | -0.2% | -0.7% | 7.2% | -0.8% | 0.4% | 2.0% | 0.7% | 0.8% | 0.9% | -0.4% | -0.5% | 1.7% | 11.7% |
2011 | 1.6% | 2.1% | 5.0% | 1.1% | -1.4% | 10.7% | -2.3% | 3.6% | 1.5% | -0.1% | -2.7% | -4.1% | 15.0% |
2012 | 3.2% | -0.1% | 3.5% | -4.6% | 3.5% | -0.3% | -2.0% | 3.2% | -0.8% | -0.7% | 0.7% | 1.2% | 6.6% |
2013 | 0.7% | -2.6% | -3.6% | 0.5% | -4.3% | -0.1% | -0.2% | 0.4% | 0.6% | 5.2% | 1.1% | 3.4% | 0.6% |
2014 | 0.8% | -0.4% | 1.0% | 3.5% | 0.2% | 4.0% | 0.2% | 2.3% | 0.7% | 0.8% | 3.5% | 3.5% | 21.8% |
2015 | 3.7% | -0.6% | 1.7% | -0.1% | 1.9% | 0.0% | 1.6% | 3.3% | -0.3% | -1.7% | 0.1% | 1.2% | 11.4% |
2016 | 0.3% | -1.1% | 5.4% | 0.4% | 0.5% | -0.7% | 0.6% | 0.1% | -0.3% | 0.0% | -0.6% | 0.0% | 4.5% |
2017 | 6.0% | 1.4% | 0.8% | 0.6% | 3.8% | 0.5% | -0.4% | 0.0% | -0.6% | 0.5% | 0.7% | -0.5% | 13.8% |
2018 | 4.1% | 0.3% | 0.9% | 5.7% | 1.4% | 1.9% | 0.3% | 0.4% | 0.2% | 1.7% | 0.5% | -1.7% | 16.3% |
2019 | 0.9% | 0.7% | 3.7% | 0.0% | 0.7% | 0.0% | 1.0% | 1.6% | -0.7% | 0.0% | 0.6% | -0.1% | 8.7% |
2020 | 0.5% | 0.8% | 0.0% | 2.8% | -0.2% | 0.3% | -0.3% | 1.9% | 5.9% | -0.8% | 3.2% | 2.0% | 17.2% |
2021 | -1.1% | 1.7% | 11.9% | 1.0% | 3.2% | -0.1% | 1.6% | 9.7% | -0.6% | 0.5% | 0.5% | -1.9% | 28.6% |
2022 | 1.4% | 0.7% | 1.9% | 1.6% | 0.6% | -0.5% | 0.0% | -0.6% | -0.2% | -2.0% | 0.6% | 0.2% | 3.7% |
2023 | 0.2% | 3.2% | -0.9% | -0.6% | 0.9% | -1.0% | -0.2% | 0.6% | -0.2% | 0.5% | -0.5% | -1.6% | 0.4% |
2024 | -0.1% | 1.1% | 0.4% | 1.4% |
NAV per Class A Unit | = $32.5883 |
NAV per Class E Unit | = $26.2611 |
NAV per Class F Unit | = $36.6515 |
NAV per Class G Unit | = $31.9166 |
As of March 31, 2024 |
The Kensington Private Equity Fund is a mutual fund trust created to provide Canadian institutions and high-net-worth individual investors with access to a diversified portfolio of private equity investments, including private equity funds and direct investments in private companies.
Kensington Private Equity Fund Distributions ($/Unit) Paid to Unitholders (Net)
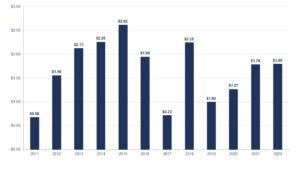
The Kensington Private Equity Fund follows a policy of distributing profits to Unitholders while reinvesting capital in new investments. It is important to note that only realized gains from investments are captured by this policy – Kensington does not consider the Fund’s “profit” to include any interim gains based on write-up’s in value while the Fund continues to hold the investment. These realized gains consist entirely of the cash profits actually received by the Fund, net of the cost of the investment. These realized gains are netted out against any realized losses (again, based on final proceeds received and not including any interim write-downs) to determine the Fund’s “Net Realized Gains” from time to time.
The first distribution of profits to the Fund’s investors occurred in 2011, with a track record of distribution growth as the underlying portfolio assets matured into profitable sales in subsequent years.
Investors should understand that the timing and amount of distributions from a private equity portfolio are unpredictable. The Fund’s ability to generate profits obviously depends on the successful selection and growth of underlying investments. However, it is also dependent on the timing of specific sale transactions, which can be impacted by broader economic conditions. As Manager of the Fund, Kensington cannot provide any assurance that the Fund will pay a distribution in any particular year or any guidance to investors on the amount of any such future distributions.
Kensington maintains a Distribution Re-Investment Program (DRIP) for investors to automatically re-invest proceeds of distributions into newly issued Units. Participation in the DRIP is entirely at the option of the investor and may be changed at any time.
Kensington updates the Net Asset Value (NAV) of the Fund and each class of Units each month, with updated valuations published on this website. These frequent updates are provided as a convenience to our investors and in accordance with applicable legal requirements, however, Kensington does not believe that a focus on short-term fluctuations in value is appropriate for private equity investors. Private Equity is a longer-term investment which should be considered by investors with at least a 5-year time horizon.
The NAV of the Kensington Private Equity Fund is determined by Kensington based on the reported values and additional information provided by the General Partners of underlying Fund investments and from available information from underlying direct investments, in each case as reported to Kensington as of the relevant valuation date.
Kensington began creating private partnerships for investors in the private equity market in 2002 and currently manages several different portfolios in this form. Each of these private partnerships is fully invested and closed to new investors. The performance of these private partnerships is confidential and disclosed only to each partnership’s investors and their advisors. Please contact us if you are an investor in a private Kensington partnership and would like additional information regarding the performance of your investment.
Get to know our diverse portfolio of companies made of incredible people and businesses.